MATLAB: Spectrum Analyzer (plotting)

Written by Paul Cracknell
Updated at February 21st, 2025
-
Moku:Go
Moku:Go General Moku:Go Arbitrary Waveform Generator Moku:Go Data Logger Moku:Go Digital Filter Box Moku:Go FIR Filter Builder Moku:Go Frequency Response Analyzer Moku:Go Logic Analyzer & Pattern Generator Moku:Go Oscilloscope & Voltmeter Moku:Go PID Controller Moku:Go Spectrum Analyzer Moku:Go Waveform Generator Moku:Go Power Supplies Moku:Go Lock-in Amplifier Moku:Go Time & Frequency Analyzer Moku:Go Laser Lock Box Moku:Go Phasemeter
-
Moku:Lab
Moku:Lab General Moku:Lab Arbitrary Waveform Generator Moku:Lab Data Logger Moku:Lab Digital Filter Box Moku:Lab FIR Filter Builder Moku:Lab Frequency Response Analyzer Moku:Lab Laser Lock Box Moku:Lab Lock-in Amplifier Moku:Lab Oscilloscope Moku:Lab Phasemeter Moku:Lab PID Controller Moku:Lab Spectrum Analyzer Moku:Lab Time & Frequency Analyzer Moku:Lab Waveform Generator Moku:Lab Logic Analyzer/Pattern Generator
-
Moku:Pro
Moku:Pro General Moku:Pro Arbitrary Waveform Generator Moku:Pro Data Logger Moku:Pro Frequency Response Analyzer Moku:Pro Oscilloscope Moku:Pro PID Controller Moku:Pro Spectrum Analyzer Moku:Pro Waveform Generator Moku:Pro Lock-in Amplifier Moku:Pro Laser Lock Box Moku:Pro Digital Filter Box Moku:Pro FIR Filter Builder Moku:Pro Phasemeter Moku:Pro Multi-instrument Mode Moku:Pro Logic Analyzer/Pattern Generator Moku:Pro Time & Frequency Analyzer
- Python API
- MATLAB API
- Arbitrary Waveform Generator
- Data Logger
- Digital Filter Box
- FIR Filter Builder
- Frequency Response Analyzer
- Laser Lock Box
- Lock-in Amplifier
- Oscilloscope
- Phasemeter
- PID Controller
- Spectrum Analyzer
- Time & Frequency Analyzer
- Waveform Generator
- Logic Analyzer & Pattern Generator
- Multi Instrument Mode
- Moku Cloud Compile
- Moku general
- LabVIEW
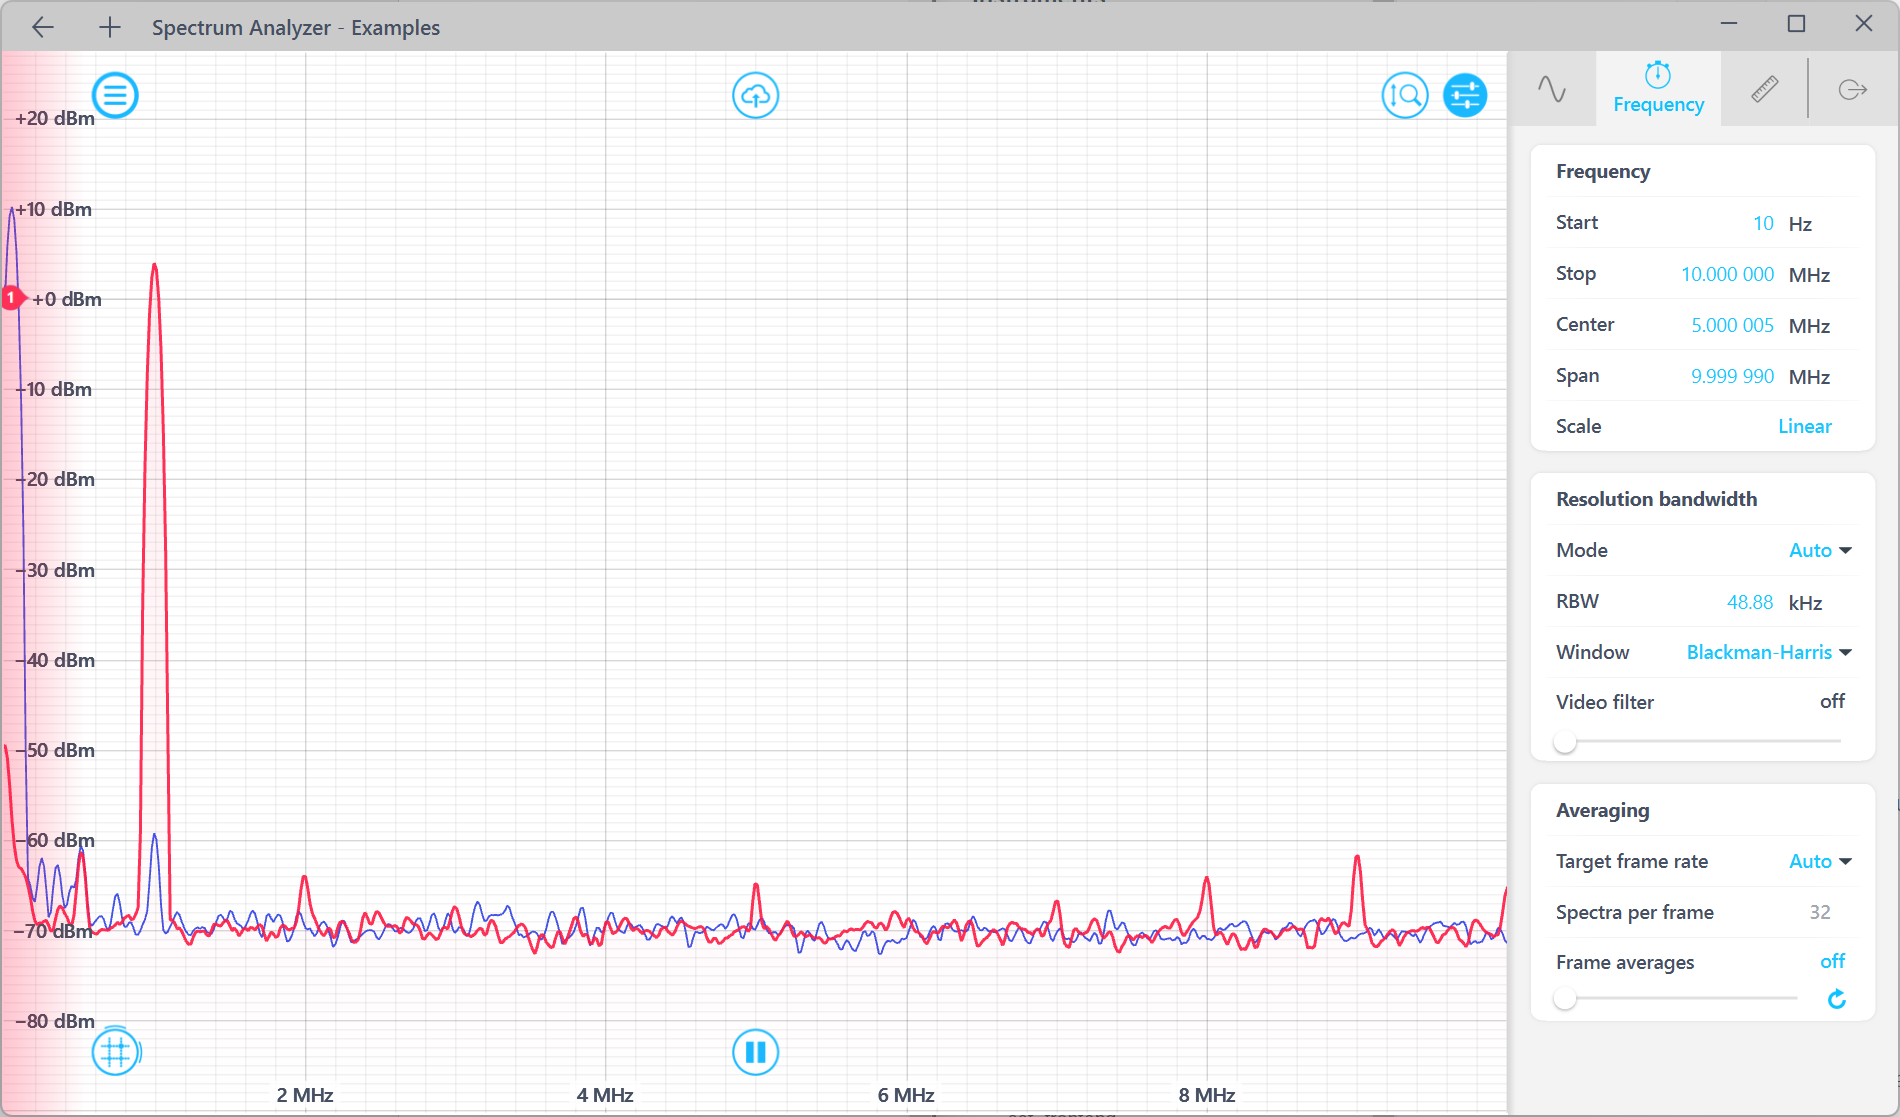
Example MATLAB script to implement the Spectrum Analyzer (plotting)
%% Basic Spectrum Analyzer Example
%
%  This example demonstrates how you can configure the Spectrum Analyzer
%  instrument to retrieve a single spectrum data frame over a set frequency
%  span.
%
%  (c) 2021 Liquid Instruments Pty. Ltd.
%

%% Connect to the Moku
% Connect to your Moku by its IP address.
i = MokuSpectrumAnalyzer('192.168.###.###');

try

    %% Configure the instrument

    % Generate a sine wave on Channel 1
    % 1Vpp, 1MHz
    i.sa_output(1, 1, 1e6);
    % Generate a sine wave on Channel 2
    % 2Vpp, 50kHz
    i.sa_output(2, 2, 50e3);

    % Configure the measurement span to from 10Hz to 10MHz
    i.set_span(10, 10e6);
    % Use Blackman Harris window
    i.set_window('BlackmanHarris');
    % Set resolution bandwidth to automatic
    i.set_rbw('Auto');

    %% Retrieve data
    % Get one frame of spectrum data and
    % set the amplitude scale to dBm
    data = i.get_data('units','dBm');

    % Set up the plots
    figure
    lh = plot(data.frequency, data.ch1, data.frequency, data.ch2);
    xlabel(gca,'Frequency (Hz)')
    ylabel(gca,'Amplitude (dBm)')

    %% Receive and plot new data frames
    while 1
        data = i.get_data('units','dBm');

        set(lh(1),'XData',data.frequency,'YData',data.ch1);
        set(lh(2),'XData',data.frequency,'YData',data.ch2);

        axis tight
        pause(0.1)
    end

catch ME
    % End the current connection session with your Moku
    i.relinquish_ownership();
    rethrow(ME)
end

i.relinquish_ownership();