Spectrum Analyzer units of measure
Converting from dBm/Hz to V/√Hz

Written by Paul Cracknell
Updated at August 30th, 2024
-
Moku:Go
Moku:Go General Moku:Go Arbitrary Waveform Generator Moku:Go Data Logger Moku:Go Digital Filter Box Moku:Go FIR Filter Builder Moku:Go Frequency Response Analyzer Moku:Go Logic Analyzer & Pattern Generator Moku:Go Oscilloscope & Voltmeter Moku:Go PID Controller Moku:Go Spectrum Analyzer Moku:Go Waveform Generator Moku:Go Power Supplies Moku:Go Lock-in Amplifier Moku:Go Time & Frequency Analyzer Moku:Go Laser Lock Box Moku:Go Phasemeter
-
Moku:Lab
Moku:Lab General Moku:Lab Arbitrary Waveform Generator Moku:Lab Data Logger Moku:Lab Digital Filter Box Moku:Lab FIR Filter Builder Moku:Lab Frequency Response Analyzer Moku:Lab Laser Lock Box Moku:Lab Lock-in Amplifier Moku:Lab Oscilloscope Moku:Lab Phasemeter Moku:Lab PID Controller Moku:Lab Spectrum Analyzer Moku:Lab Time & Frequency Analyzer Moku:Lab Waveform Generator Moku:Lab Logic Analyzer/Pattern Generator
-
Moku:Pro
Moku:Pro General Moku:Pro Arbitrary Waveform Generator Moku:Pro Data Logger Moku:Pro Frequency Response Analyzer Moku:Pro Oscilloscope Moku:Pro PID Controller Moku:Pro Spectrum Analyzer Moku:Pro Waveform Generator Moku:Pro Lock-in Amplifier Moku:Pro Laser Lock Box Moku:Pro Digital Filter Box Moku:Pro FIR Filter Builder Moku:Pro Phasemeter Moku:Pro Multi-instrument Mode Moku:Pro Logic Analyzer/Pattern Generator Moku:Pro Time & Frequency Analyzer
- Python API
- MATLAB API
- Arbitrary Waveform Generator
- Data Logger
- Digital Filter Box
- FIR Filter Builder
- Frequency Response Analyzer
- Laser Lock Box
- Lock-in Amplifier
- Oscilloscope
- Phasemeter
- PID Controller
- Spectrum Analyzer
- Time & Frequency Analyzer
- Waveform Generator
- Logic Analyzer & Pattern Generator
- Multi Instrument Mode
- Moku Cloud Compile
- Moku general
- LabVIEW
- mokucli
The Moku Spectrum Analyzer can display the spectrum amplitude in various units (dBm, Vrms, Vpp, and dBV). Additionally, you can select corresponding power spectral density (PSD) units (dBm/Hz, Vrms/√ Hz, Vpp/√Hz, and dBV/√ Hz). It is worth noting that the Resolution Bandwidth (RBW) setting only affects the measurement in PSD units.
Below is an example from demo mode, where the channel 1 peak is shown at -68.68 dBm/Hz.
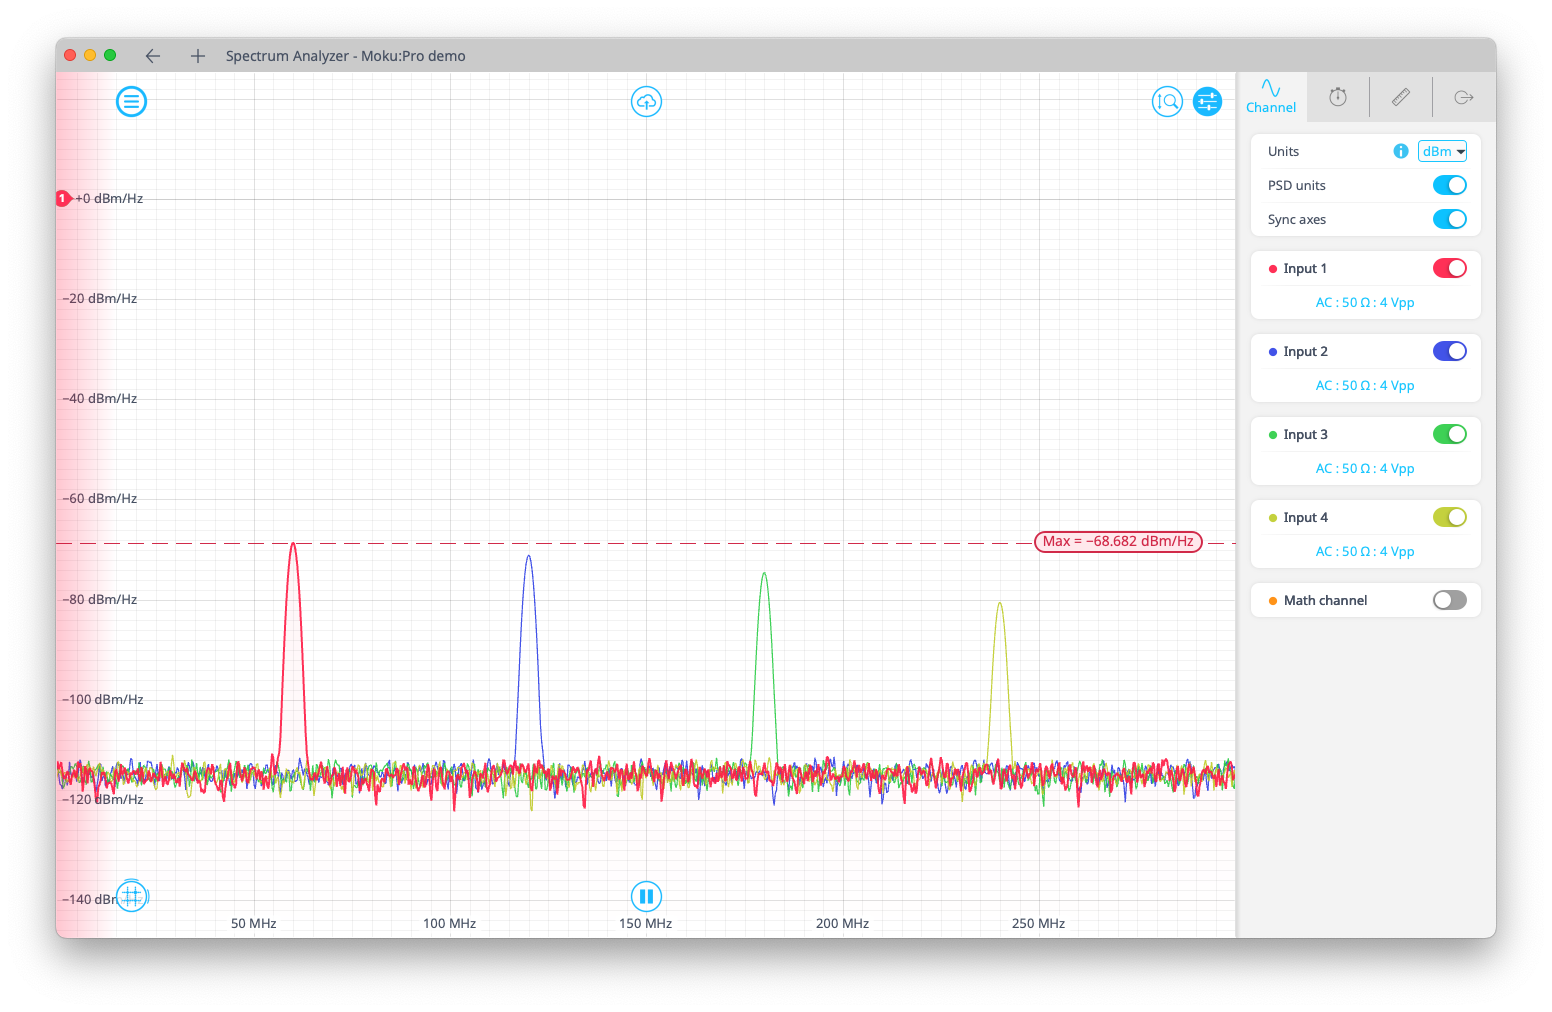
This can be converted to Vrms/√Hz by relationship P [mW/Hz] = 10 (P [dBm/Hz] / 10)
So in this case, P = 1.355 x 10 -7 mW/Hz
Also, V= √( P x R) and that here 50 Ω is the conventional nominal impedance.
Thus the spectral peak in volts, allowing for conversion from mW to W, is
V = √( 50 x 1.35 x 10 -10)
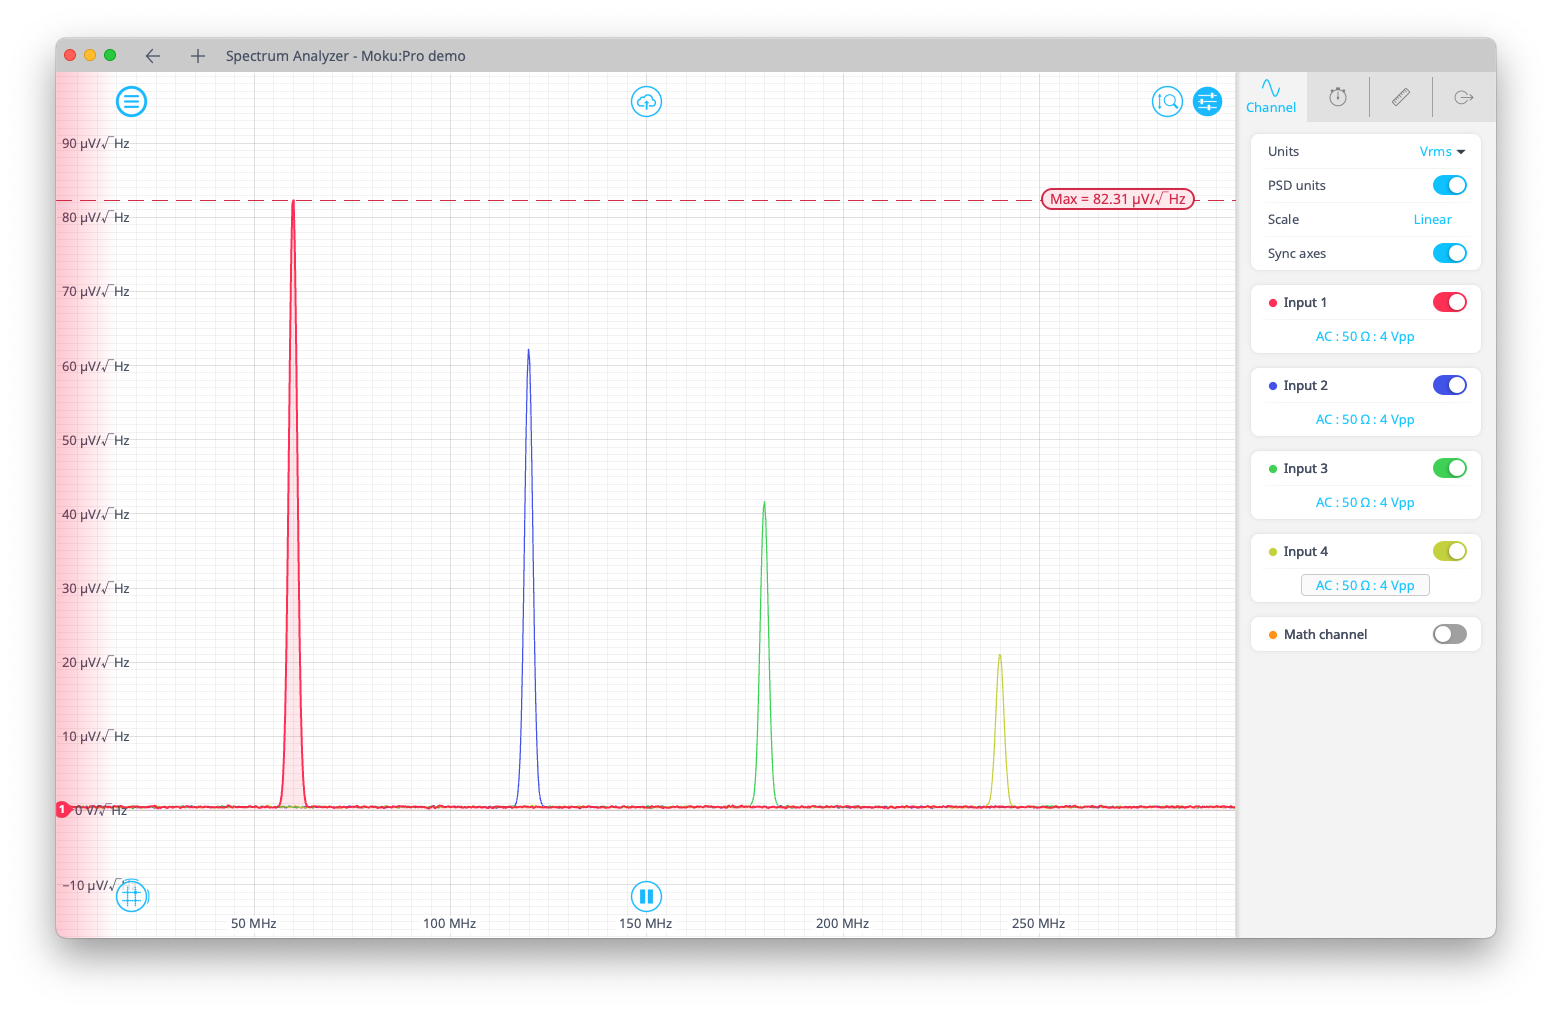
V = 82.31 μV/√Hz
In this second screenshot of the Spectrum Analyzer in demo mode, the units have been switch to uV/√Hz.