What are the definitions of the Oscilloscope's measurements?

Written by Paul Cracknell
Updated at July 23rd, 2024
-
Moku:Go
Moku:Go General Moku:Go Arbitrary Waveform Generator Moku:Go Data Logger Moku:Go Digital Filter Box Moku:Go FIR Filter Builder Moku:Go Frequency Response Analyzer Moku:Go Logic Analyzer & Pattern Generator Moku:Go Oscilloscope & Voltmeter Moku:Go PID Controller Moku:Go Spectrum Analyzer Moku:Go Waveform Generator Moku:Go Power Supplies Moku:Go Lock-in Amplifier Moku:Go Time & Frequency Analyzer Moku:Go Laser Lock Box Moku:Go Phasemeter
-
Moku:Lab
Moku:Lab General Moku:Lab Arbitrary Waveform Generator Moku:Lab Data Logger Moku:Lab Digital Filter Box Moku:Lab FIR Filter Builder Moku:Lab Frequency Response Analyzer Moku:Lab Laser Lock Box Moku:Lab Lock-in Amplifier Moku:Lab Oscilloscope Moku:Lab Phasemeter Moku:Lab PID Controller Moku:Lab Spectrum Analyzer Moku:Lab Time & Frequency Analyzer Moku:Lab Waveform Generator Moku:Lab Logic Analyzer/Pattern Generator
-
Moku:Pro
Moku:Pro General Moku:Pro Arbitrary Waveform Generator Moku:Pro Data Logger Moku:Pro Frequency Response Analyzer Moku:Pro Oscilloscope Moku:Pro PID Controller Moku:Pro Spectrum Analyzer Moku:Pro Waveform Generator Moku:Pro Lock-in Amplifier Moku:Pro Laser Lock Box Moku:Pro Digital Filter Box Moku:Pro FIR Filter Builder Moku:Pro Phasemeter Moku:Pro Multi-instrument Mode Moku:Pro Logic Analyzer/Pattern Generator Moku:Pro Time & Frequency Analyzer
- Python API
- MATLAB API
- Arbitrary Waveform Generator
- Data Logger
- Digital Filter Box
- FIR Filter Builder
- Frequency Response Analyzer
- Laser Lock Box
- Lock-in Amplifier
- Oscilloscope
- Phasemeter
- PID Controller
- Spectrum Analyzer
- Time & Frequency Analyzer
- Waveform Generator
- Logic Analyzer & Pattern Generator
- Multi Instrument Mode
- Moku Cloud Compile
- Moku general
- LabVIEW
- mokucli
Frequency

Frequency of the signal as determined by the time between rising or falling edges
Phase
Phase of strongest frequency component with respect to a perfect sine wave
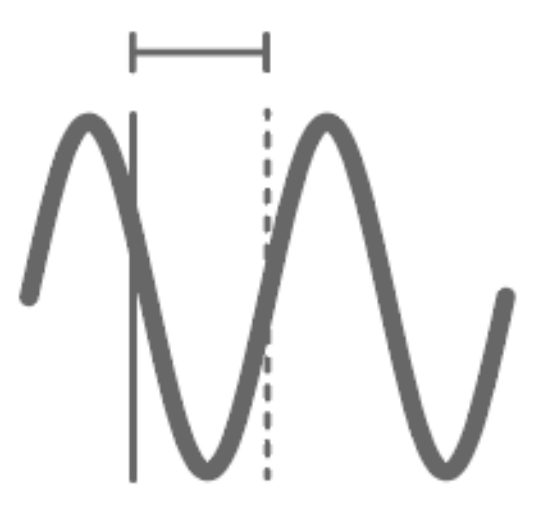
Period

Time between pairs of rising or falling edges
Duty Cycle

Ratio of the time spent above the median to that spent below it
Pulse Width

Time the signal spends above the median
Negative Width

Time the signal spends below the median
Mean

Average value of the signal
RMS

Root-Mean-Square value of the signal
Cycle Mean

Average value of the signal, discounting partial cycles at the beginning and end of the frame
Cycle RMS

Root-Mean-Square value of the signal, discounting partial cycles at the beginning and edge of the frame
Standard Deviation

Mathematical description of the spread of the points in the signal
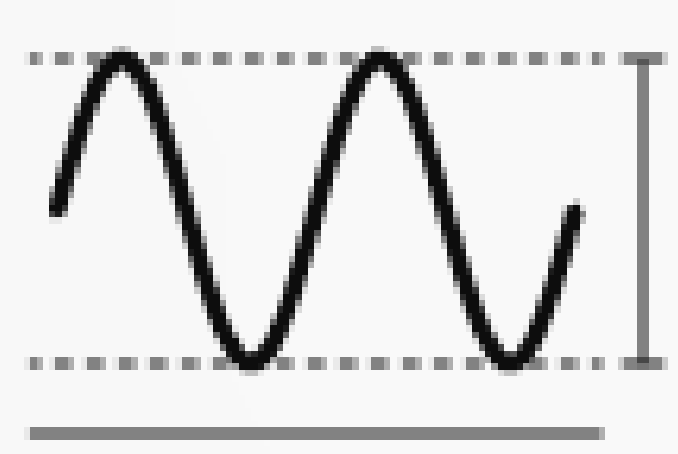
Peak to Peak

Difference between the highest and lowest voltage in the signal
Amplitude

Difference between the high- and low-level voltage, excluding over- and undershoot
Maximum

Highest voltage in the signal
Minimum

Lowest voltage in the signal
High Level

Highest voltage in the signal, excluding overshoot
Low Level

Lowest voltage in the signal, excluding undershoot
Rise Time

Time taken for the signal to transition from 10% to 90% of the way from minimum to maximum
Fall Time

Time taken for the signal to transition from 90% down to 10% of the way from maximum to minimum
Rise Rate

Rate at which the signal transitions from 10% to 90% of the way from minimum to maximum
Fall Rate

Rate at which the signal transitions from 90% to 10% of the way from maximum to minimum
Overshoot

Distance the signal shoots above the maximum level before settling
Undershoot

Distance the signal shoots below minimum level before settling
Fringe visibility (%)
Measurement of interference